


Indicator
|
Unit of Measure
|
2012
|
|||
1st Qtr.
|
2nd Qtr.
|
3rd Qtr.
|
4th Qtr.
|
||
Customer Satisfaction
|
|||||
Billed Connections
|
HHs
|
7,273
|
7,440
|
7,606
|
7,713
|
Billed Residential Connections
|
HHs
|
6,536
|
6,686
|
6,836
|
6,931
|
Billed Commercial Connections
|
HHs
|
737
|
754
|
770
|
782
|
Average Leak Response Time
|
Minutes
|
||||
Average Leak Repair Time
|
Minutes
|
||||
Water Resource Management
|
|||||
Actual production (volume)
|
Cu.M.
|
680,182
|
704,390
|
718,094
|
750,551
|
Billed Consumption (volume)
|
Cu.M.
|
407,038
|
437,704
|
451,927
|
431,863
|
Length of Transmission Lines
|
Kilometers
|
||||
Length of Distribution Lines
|
Kilometers
|
||||
System Loss Management
|
|||||
Non-Revenue Water (volume)
|
Cu.M.
|
206,678
|
201,600
|
199,950
|
243,233
|
% of NRW to Total Production
|
%
|
30.39
|
28.64
|
27.84
|
32.46
|
% of AFW to Total Production
|
%
|
69.61
|
71.36
|
72.16
|
67.54
|
Number of Leaks Reported
|
Leaks
|
379
|
316
|
381
|
236
|
Number of Leaks Repaired
|
Leaks
|
351
|
292
|
363
|
219
|
Number of Meters Replaced
|
Meters
|
13
|
16
|
12
|
16
|
Number of Meters Recalibrated
|
Meters
|
12
|
27
|
4
|
163
|
Human Resource Management
|
|||||
Total Workforce
|
Employees
|
76
|
78
|
85
|
79
|
Permanent
|
Employees
|
41
|
42
|
42
|
41
|
Casual
|
Employees
|
8
|
7
|
7
|
7
|
Contractual / J.O.
|
Employees
|
27
|
29
|
36
|
31
|
Staff to Connection Ratio
|
ratio
|
1:96
|
1:95
|
1:89
|
1:98
|
Permanent to Connection Ratio
|
ratio
|
1:177
|
1:177
|
1:181
|
1:188
|
Financial Management
|
|||||
On-Time Payment
|
%
|
69.17%
|
71.14%
|
68.49%
|
69.94%
|
Collection Efficiency
|
%
|
90.69%
|
95.11%
|
94.56%
|
94.95%
|
Operating Ratio
|
%
|
80.33%
|
89.53%
|
90.96%
|
92.25%
|


OTHER FIGURES


STATISTICS HIGHLIGHTS

Map of Distribution Network in Catbalogan
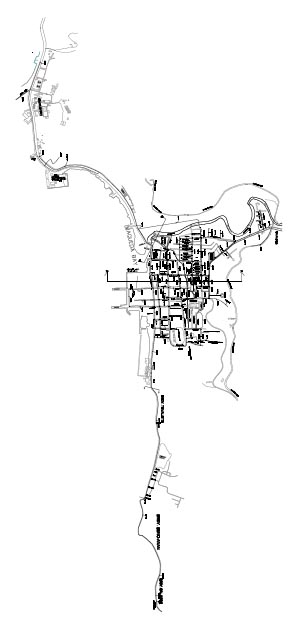
Click the picture to enlarge Image >>
DISTRIBUTION NETWORK

The As-built drawing covers the complete plan of water system in Catbalogan, the location of all gate valves, fire hydrants, length and size of pipes and other appurtenance

CATBALOGANWATERDISTRICT
Pier II, Allen Avenue Ext.,
Catbalogan, Western Samar, Phillipines 6700
committed to be a customer service-oriented utility

Pier II, Allen Avenue extension, Catbalogan, Western Samar, Philippines.
Telephone Numbers: (055) 251-2669 ; (055) 543-9259
